Altcoins
Bitcoin at Crossroads with Heavy Liquidations: Will $BTC Surpass $71,000?
Faced with rejection at $70,000, Bitcoin fell to $68,100 in a matter of hours. Is this the end of Bitcoin’s recovery rally, or will the bull run continue to end the week above $73,000?
Hours after hitting the $70,000 mark following a month-long correction phase, the price of a single Bitcoin is back at $67,800. The intraday pullback pushes three-week yields down to 24% and forms a high rejection candle.
As bullish positions lose traction, Bitcoin and altcoins are on shaky ground. So, will the BTC price trend see a huge correction this week or will a strong end to the week send the bears reeling?
Another pullback in the rounded bottom for Bitcoin
On the 4H chart, the BTC price trend shows a rapid reversal over the past three weeks from the low of $54,400 to the high of $70,000. However, the 2% pullback from $70,000 and the upper trendline in a 4-hour candle break the $68,000 support.
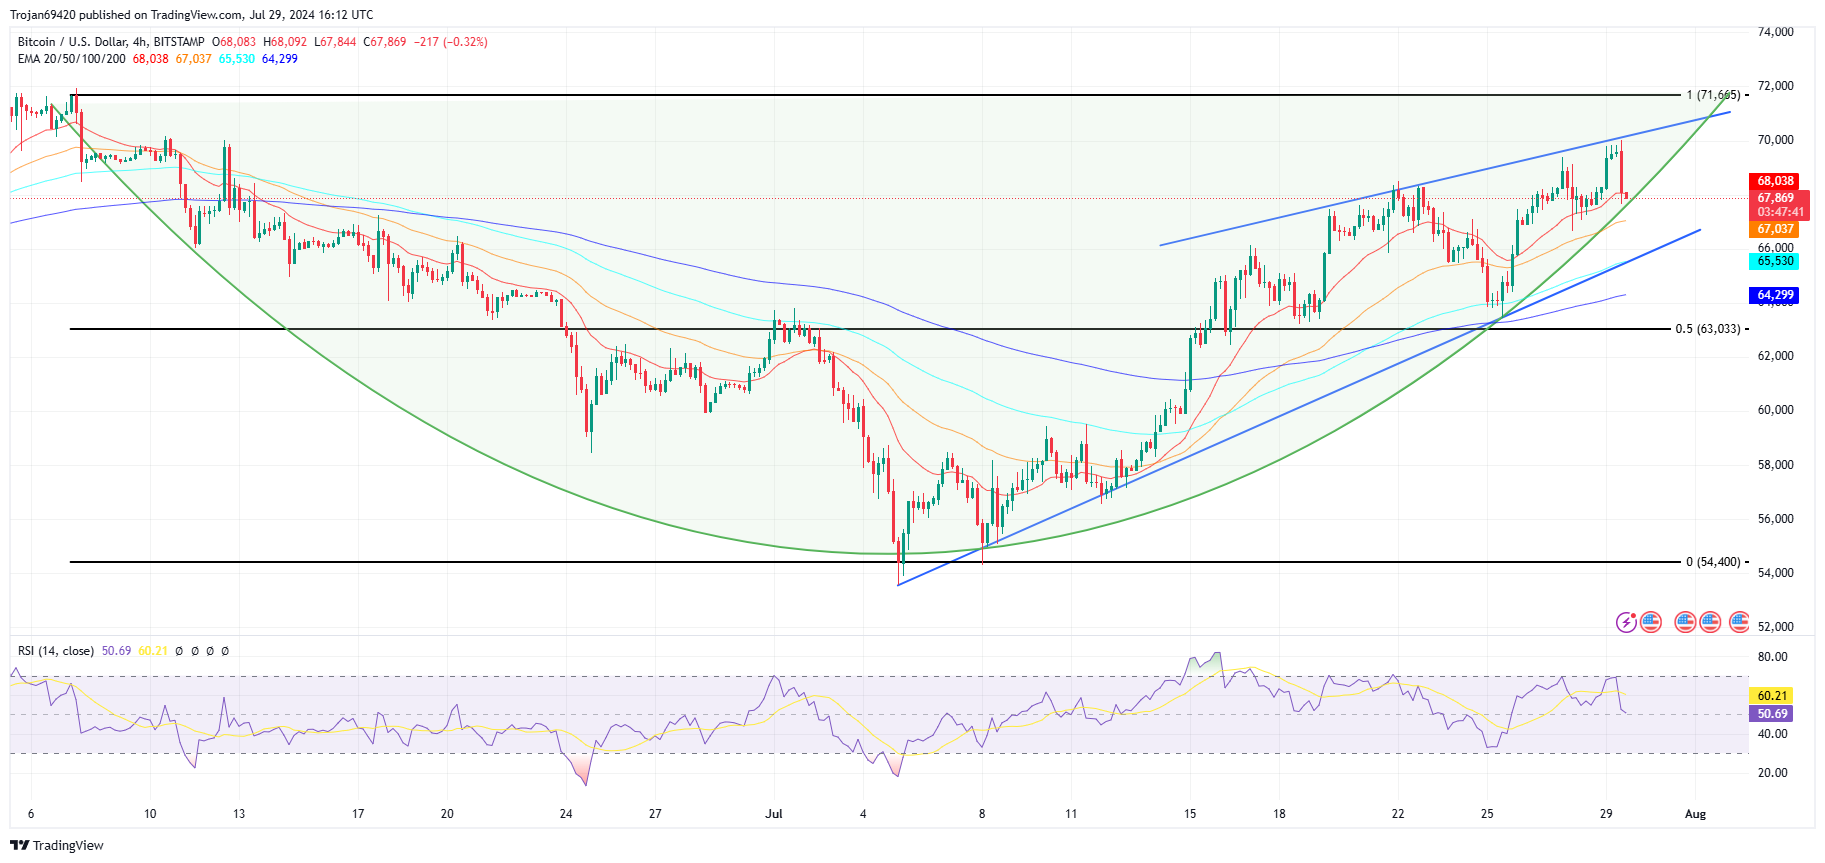

Additionally, a rising wedge pattern is visible with two ascending trendlines. Currently, Bitcoin is trading at $67,844 and warns of bearish continuation as a second red candle forms.
The RSI line shows a double top reversal from the overbought boundary, which supports the bearish scenario. Meanwhile, the dynamic support at the 20 EMA on the 4H chart is failing; the 50 EMA is next on the list.
Derivatives have a bullish outlook
According to CryptoquantBitcoin’s open interest has reached $20.54 billion, up 6.18% in the last 24 hours. However, with the recent change in momentum and the rapid drop from $70,000, the Taker buy-sell ratio is bearish, with the sell side at 0.57.


Regarding liquidations, according to Cryptoglass$26.74 million worth of Bitcoin long positions were liquidated in the last four hours. Meanwhile, the cryptocurrency market saw a loss of $53.23 million worth of long liquidations.
Will Bitcoin Surpass $70,000 This Week?
A downward trend reversal on the 4H chart indicates a potential roadmap in the Bitcoin price trend. Currently, the recent correction remains a minor decline. However, the 1.04% intraday decline and a potential decline ahead hint at a further correction.
Beyond the rounded bottom, the rising wedge support trendline is the next turning point for Bitcoin. Therefore, with a dominant bull run in motion and a strong trendline in action, the bulls should regain control.
According to Fibonacci levels, the uptrend could reach the peak of $71,665 by the end of this week.
Disclaimer: This content is informational and should not be considered financial advice. The opinions expressed in this article may include the personal opinions of the author and do not reflect the opinion of The Crypto Basic. Readers are encouraged to conduct thorough research before making any investment decisions. The Crypto Basic is not responsible for any financial losses.
-Advertisement-