Ethereum
Bitcoin (BTC) Price Drops 7% as Ethereum ETF Craze Fades
Bitcoin price fell below $64,000 on July 25, down 7% from its weekly peak of $68,477. An on-chain analysis explores how Bitcoin miners selling amid market euphoria may have triggered the current price pullback.
Bitcoin Price Drops as Ethereum ETF Hype Slows
The cryptocurrency market, including Bitcoin, has been on a strong uptrend since July 5, driven by favorable macroeconomic factors in the United States. Initially, dovish NFP and CPI reports for June 2023 boosted demand for risk assets, including cryptocurrencies.
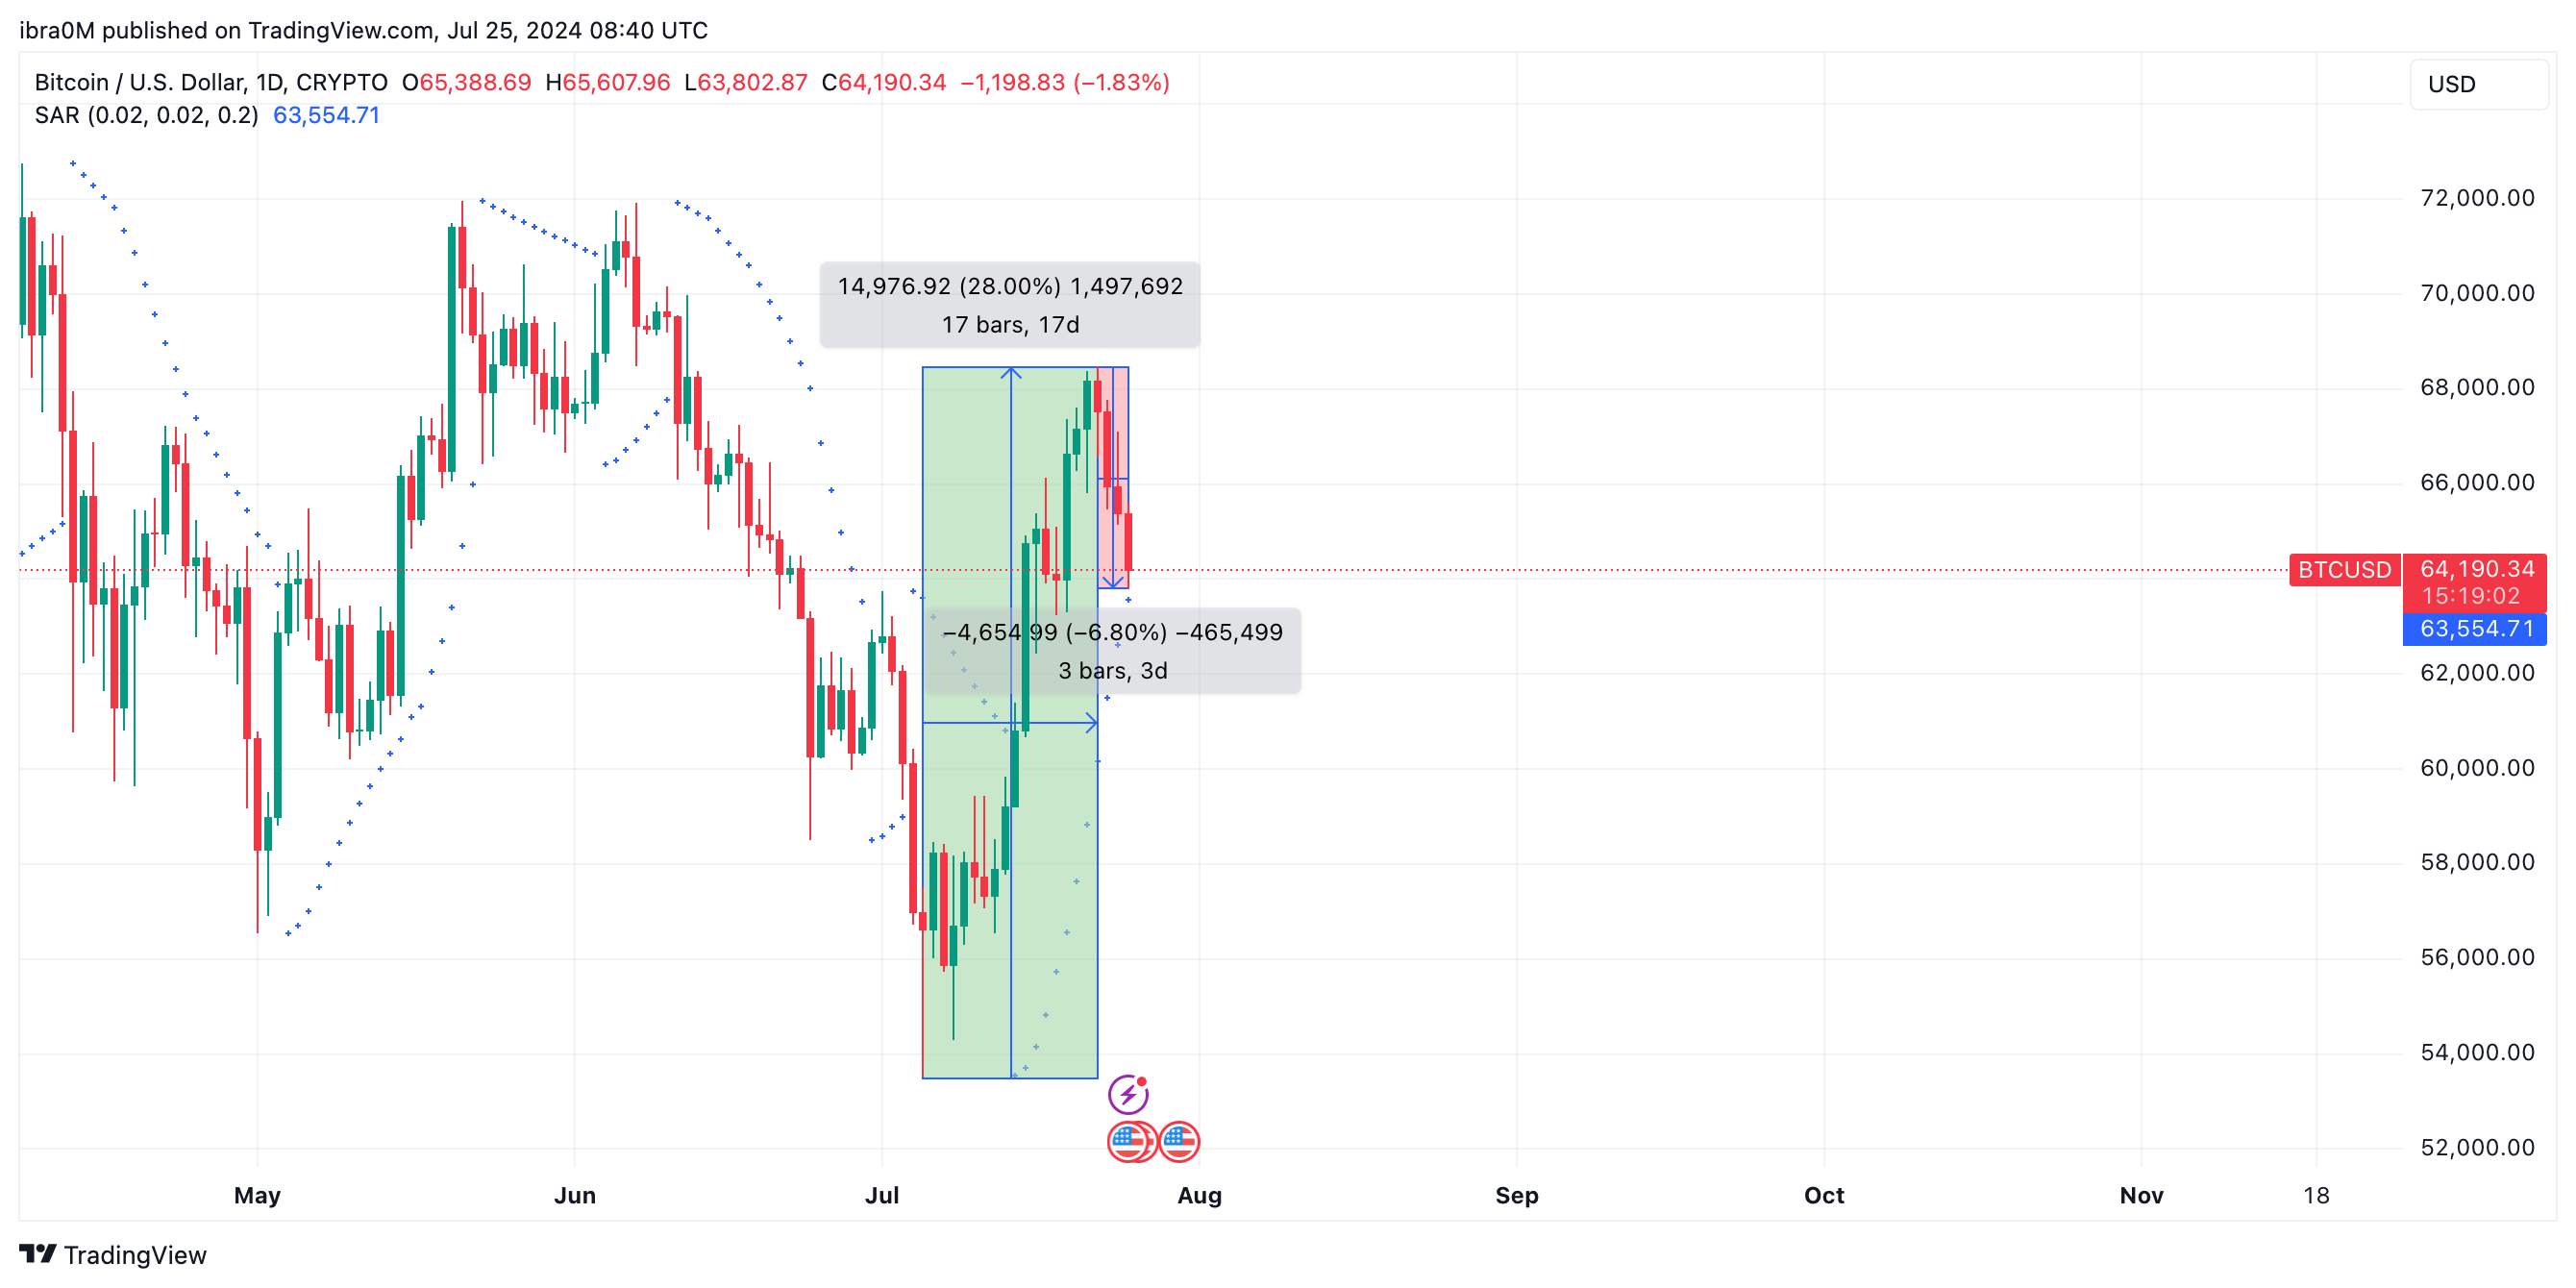
The rally intensified on July 22, fueled by the launch of Ethereum ETFs and President Biden’s withdrawal from the 2024 presidential race, positioning crypto-friendly Donald Trump as a serious contender. This glut of bullish catalysts propelled Bitcoin’s price a remarkable 28% in 17 days, from $53,540 on July 5 to $68,477 on July 22.


Notably, the price level of $68,477 is Bitcoin’s highest level in over 30 days, dating back to June 10, 2024. Unsurprisingly, bullish derivatives traders have built up LONG positions worth over $1 billion in anticipation of a breakout of $70,000.
However, market events over the past 48 hours suggest that the $70,000 target is now unlikely in the monthly time frame. Looking at the chart above, we see that the BTC price is now down 7% from its peak of $68,477 on July 22, while it fell to $63,802 on Thursday, July 25.
Bitcoin miners sold 20,000 BTC in 10 days
First, there is an indication that many strategic cryptocurrency traders who bought BTC in the run-up to the Ethereum ETF Launched are now quickly moving to “sell the news” to lock in some of the unrealized profits they have accumulated over the past few weeks.
But taking a closer look at recent on-chain data trends, Bitcoin miners have also been trending lower since the market recovery began, a move that is obviously key to the current Bitcoin price correction.
The IntoTheBlock Miner Reserves chart below tracks BTC holdings controlled by recognized miners and mining pools. Declining miner reserves indicate continued selling, which often negatively impacts the price, and vice versa.
Bitcoin miners held a total of 1.92 million BTC as of July 15. But while the Ethereum ETF went viral after the July 23 launch date was announced, Bitcoin miners capitalized on the renewed investor interest to stage a massive selloff.
At the time of writing, July 25, Bitcoin miners only hold 1.90 million BTC in their reserves, reflecting a sale of 20,000 BTC over the past 10 days. When miners on the blockchain network start selling their holdings, it often triggers a bearish price reaction for a number of reasons.
First, the sale of 20,000 BTC by miners has effectively diluted the Bitcoin market supply by $1.28 billion. More importantly, it discourages potential new entrants from entering the market, fearing that the continued trend of miners selling billions of dollars will hurt their profits in the short term.
In summary, the combination of traders cashing in their profits and miners selling their holdings has contributed to the recent drop in Bitcoin’s price. Without a significant change in these bearish trends, Bitcoin could face further downward movement in the near term.
Bitcoin Price Prediction: Trend Reversal to $60,000 Is Imminent
After ten days of liquidation by miners, the supply of Bitcoin on the market has increased by $1.28 billion, deterring new investors concerned about short-term losses. Indeed, BTC recently fell by 7% after the launch of Ethereum ETFs on July 23.
Technical indicators on the daily BTC/USD price chart also confirm this negative Bitcoin price outlook.
Currently, BTC is trading near $64,008, with the Bollinger Bands showing resistance at $70,409 and support at $54,053. The Parabolic SAR indicates a potential downtrend, while the Balance of Power is at -0.76, reinforcing the bearish sentiment.
To avoid further decline, Bitcoin must reclaim the $66,000 resistance level. If the bearish pressure persists, BTC could test the next key support level at $62,231. Traders should keep a close eye on these levels as a break below $60,000 could trigger additional selling pressure and further downside risks.
Disclaimer: This content is informational and should not be considered financial advice. The opinions expressed in this article may include the personal opinions of the author and do not reflect the opinion of The Crypto Basic. Readers are encouraged to conduct thorough research before making any investment decisions. The Crypto Basic is not responsible for any financial losses.
-Advertisement-