Ethereum
Solana’s Run to $250 Increases as BTC Nears $70,000
Solana is exhibiting an inverse head and shoulders pattern on the 4H chart with a neckline at $185. Amid a market recovery, the overnight surge in SOL tokens suggests a clear rise towards the $250 mark.
As Bitcoin approaches the $70,000 mark, the altcoin market is rising at breakneck speed, with many touting a new all-time high. In the midst of all this, the fourth-largest cryptocurrency, Solanais preparing for a breakthrough in shorter time frames.
As the sidelines anticipate a domino effect leading to massive effects on the daily chart, the $250 junction is the next target. Will Solana continue its bull run to reach the $250 target this week?
Solana Pattern Breakout Opens Path Towards $200
Solana is forming an uptrend with a strong bullish trend on the 4H chart, offering multiple bounces. Moreover, the bull run with the support trendline is 55% and breaks above $190.
However, the $185 resistance zone leads to a sideways move and an inverse head and shoulders pattern.
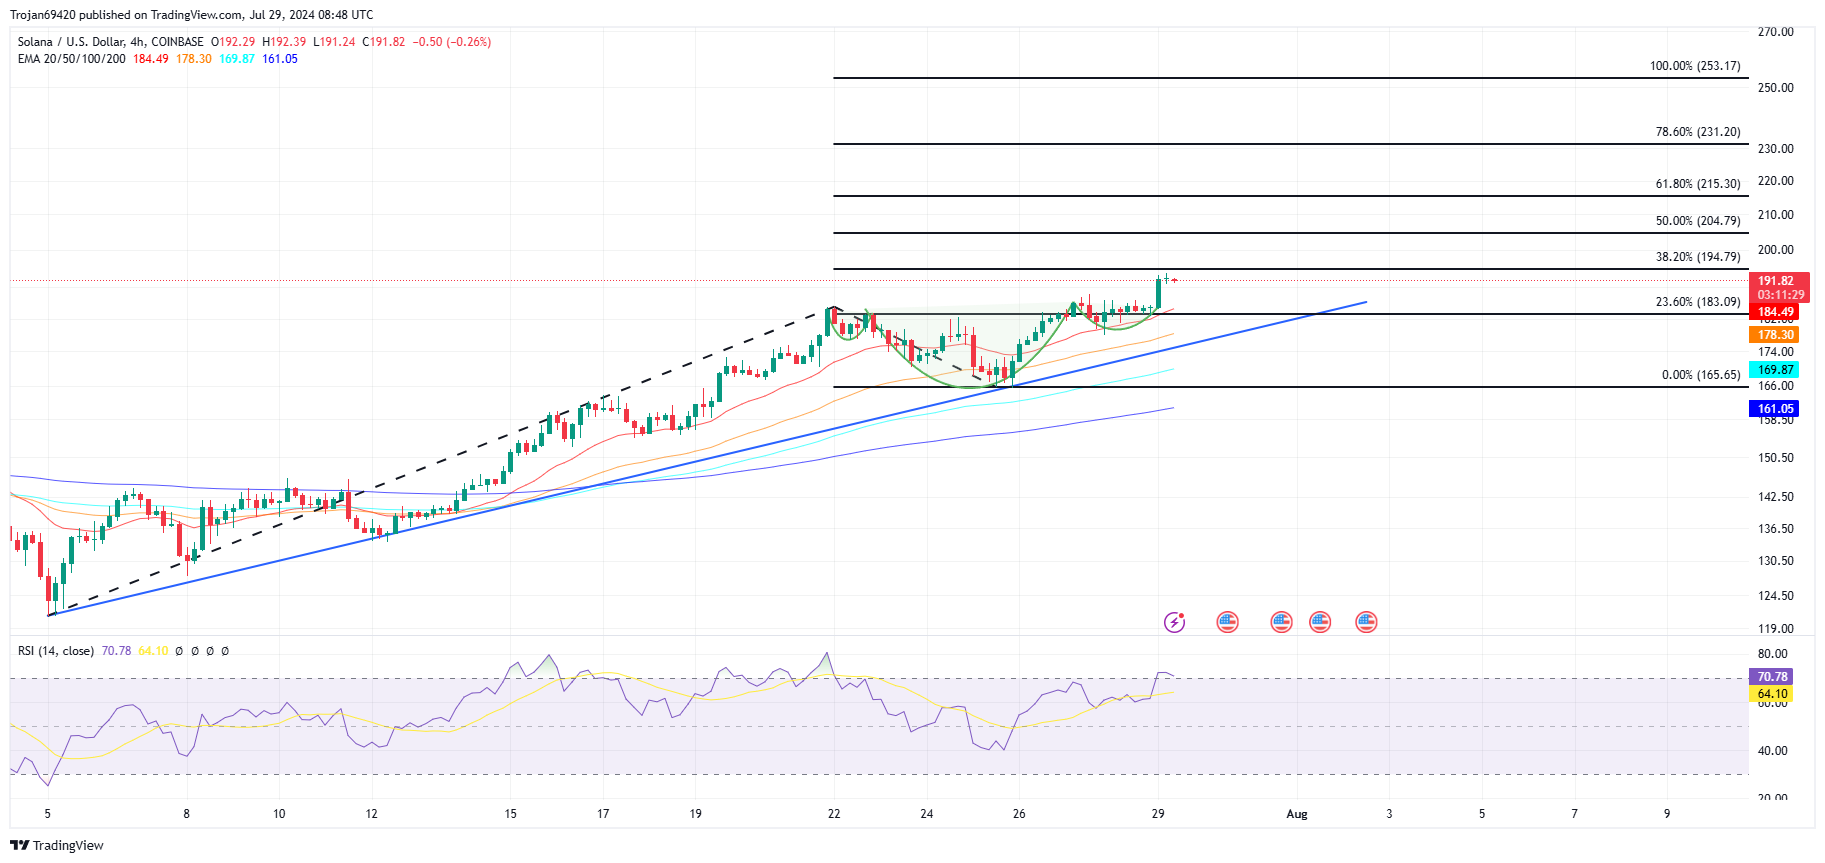

Finding the bullish push with the general market recovery, Solana broke the neckline with an intraday rise of 3.68%. Moreover, the 12% jump since last Friday triggers a bullish candle sequence and approaches the psychological mark of $200. Currently, the SOL token is trading at a market price of $191.90 and a market cap of $89.12 billion.
Now moving on to the technical indicators, the RSI line is entering the overbought territory on the 4H chart. Thus, a minor retest of the bullish breakout is a possibility. Moreover, the possibility of evening stars is increasing on the 4H chart with a recent Doji candle.
Active Solana Addresses Surpass 2 Million
In a broader sense, the growing strength of the Solana network is fueling the rise in the price of the SOL token. With a TVL of $5.667 billion, the third-largest chain is reaching a significant milestone in terms of active users.


According to the number of active addresses on the Solana network per The blockthe metric reaches 2 million.
Will SOL Price Exceed $250?
Retracing the Fibonacci levels during the bullish period, the inverse head and shoulders breakout rally faces opposition at the 38.20% Fibonacci level. Moreover, as the broader market recovers, Solana breaking above $200 will trigger the next leg of the bullish period.
According to the Fibonacci levels, Solana could reach $231 or $253 levels in the coming days.
Disclaimer: This content is informational and should not be considered financial advice. The opinions expressed in this article may include the personal opinions of the author and do not reflect the opinion of The Crypto Basic. Readers are encouraged to conduct thorough research before making any investment decisions. The Crypto Basic is not responsible for any financial losses.
-Advertisement-